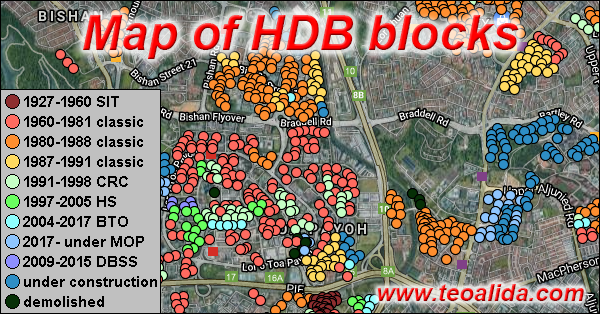
Map of HDB blocks – colored by height
This map is an alternative to the map of HDB blocks colored by construction year, which is one of most popular projects I made on this website.
Rounded squares = standing and under construction, diamonds = demolished blocks.
As December 2023 the map contains 12794 residential buildings, with the following breakdown:
| Icon color . . . | demolished | standing 1936-1991 | standing 1991-2006 | standing 2004-present | under construction |
|---|---|---|---|---|---|
 unknown floors unknown floors | 205 | 119 | 2 | 3 | |
 1 floors 1 floors | 32 | ||||
| 2 floors | 122 | 93 | 4 | ||
 3 floors 3 floors | 225 | 30 | |||
| 4 floors | 142 | 874 | 8 | ||
| 5 floors | 24 | 14 | |||
 6 floors 6 floors | 46 | 16 | 4 | 2 | |
| 7 floors | 71 | 12 | 11 | ||
| 8 floors | 3 | 51 | 29 | 2 | 3 |
 9 floors 9 floors | 25 | 177 | 35 | 4 | |
| 10 floors | 100 | 427 | 118 | 6 | 23 |
 11 floors 11 floors | 49 | 477 | 155 | 22 | 14 |
| 12 floors | 64 | 1470 | 420 | 52 | 41 |
 13 floors 13 floors | 55 | 678 | 274 | 210 | 40 |
| 14 floors | 32 | 210 | 270 | 126 | 128 |
 15 floors 15 floors | 19 | 94 | 392 | 205 | 82 |
| 16 floors | 27 | 190 | 574 | 374 | 53 |
 17 floors 17 floors | 8 | 46 | 262 | 280 | 56 |
| 18 floors | 40 | 131 | 147 | 23 | |
 19 floors 19 floors | 24 | 65 | 72 | 19 | |
| 20 floors | 10 | 55 | 58 | 61 | 13 |
 21 floors 21 floors | 28 | 57 | 22 | 16 | |
| 22 floors | 1 | 41 | 29 | 45 | 13 |
 23 floors 23 floors | 6 | 14 | 16 | 12 | 6 |
| 24 floors | 7 | 13 | 17 | 22 | |
| 25 floors | 16 | 243 | 102 | 40 | 9 |
 26 floors 26 floors | 3 | 47 | 3 | ||
| 27 floors | 3 | 7 | 21 | 7 | |
| 28 floors | 16 | 13 | 5 | ||
| 29 floors | 7 | 3 | 8 | ||
 30 floors 30 floors | 94 | 41 | 5 | ||
 31 floors 31 floors | 8 | 9 | |||
| 32 floors | 6 | 8 | |||
| 33 floors | 8 | 4 | |||
 34 floors 34 floors | 5 | 3 | |||
| 35 floors | 9 | ||||
| 36 floors | 11 | 5 | |||
 37 floors 37 floors | 2 | ||||
| 38 floors | 16 | 2 | |||
| 39 floors | 1 | 6 | |||
 40 floors 40 floors | 6 | 70 | 16 | ||
 41 floors 41 floors | 3 | ||||
| 42 floors | 5 | 1 | |||
| 43 floors | 8 | 2 | |||
 44 floors 44 floors | 3 | ||||
| 45 floors | 4 | 3 | |||
| 46 floors | 1 | ||||
 47 floors 47 floors | 9 | 12 | |||
| 48 floors | 2 | 3 | |||
| 49 floors | |||||
 50 floors 50 floors | 7 | 2 |
Instructions
Click block markers on map to view year built, number of floors, number of units, upgrading programmes, typical floor plans, chances to get SERS, etc (one block at time).
Use search box inside map to navigate to a specific location, town, block number, street name or postal code.
Use filter boxes below map to show only blocks containing specific info. Search is instant so if you type 10-letter word you force map searching 10 times. For faster results try copy-pasting:
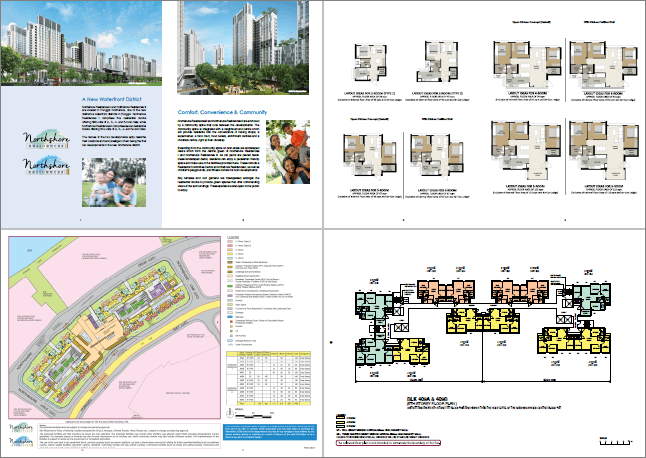
- Project name: type “BTO 2020” or “SERS 2003” to see projects sold via specific scheme in a specific year, or type a BTO name to see only it.
- Completion year: type a number to see blocks completed in specific year.
- Highest floor: type a number to see blocks of a specific number of floors.
- Number of units: type 1-room, 2-room, 3-room, 4-room, 5-room, executive, studio, etc, to see blocks having a particular flat type.
- Unit number: type stack 345, not #12-345 to see in which block is located (available for recent blocks, most blocks built before 2005 don’t have unit numbers in database).
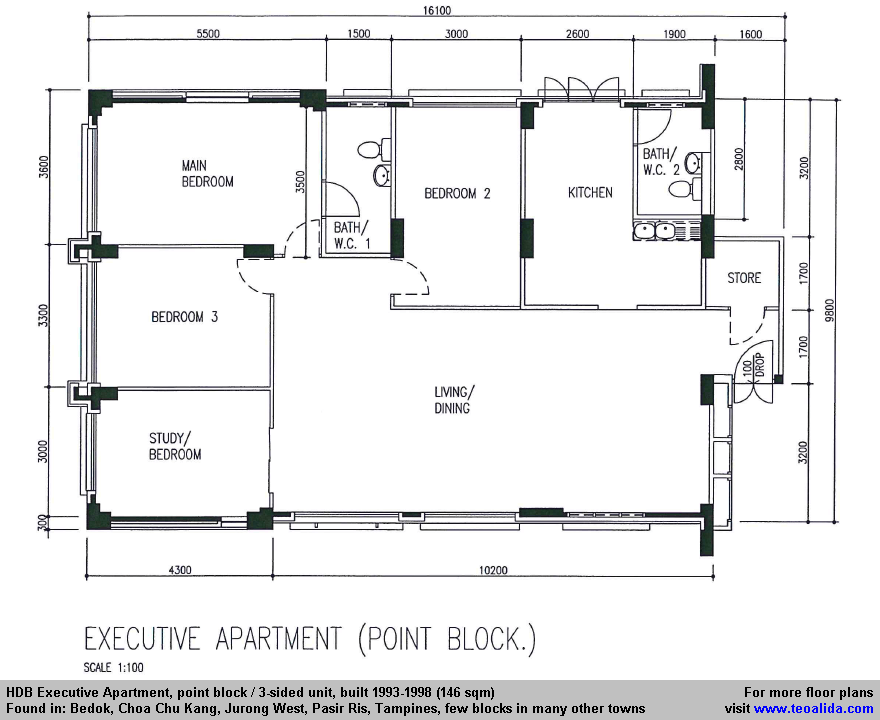
- Possible floor plans: copy-paste URL of a floor plan to see in which blocks can be found, or “to be added” to see blocks without floor plans (you can contribute by sending me floor plans).
I can guarantee 100% accuracy for block numbers, street addresses, unit numbers, lease years, number of units breakdown by flat type, etc. Sources of each information is indicated HERE.
I cannot guarantee accuracy for floor plans, they being added from my personal research, so I need your help, please report wrong floor plans!
About me & history of HDB map
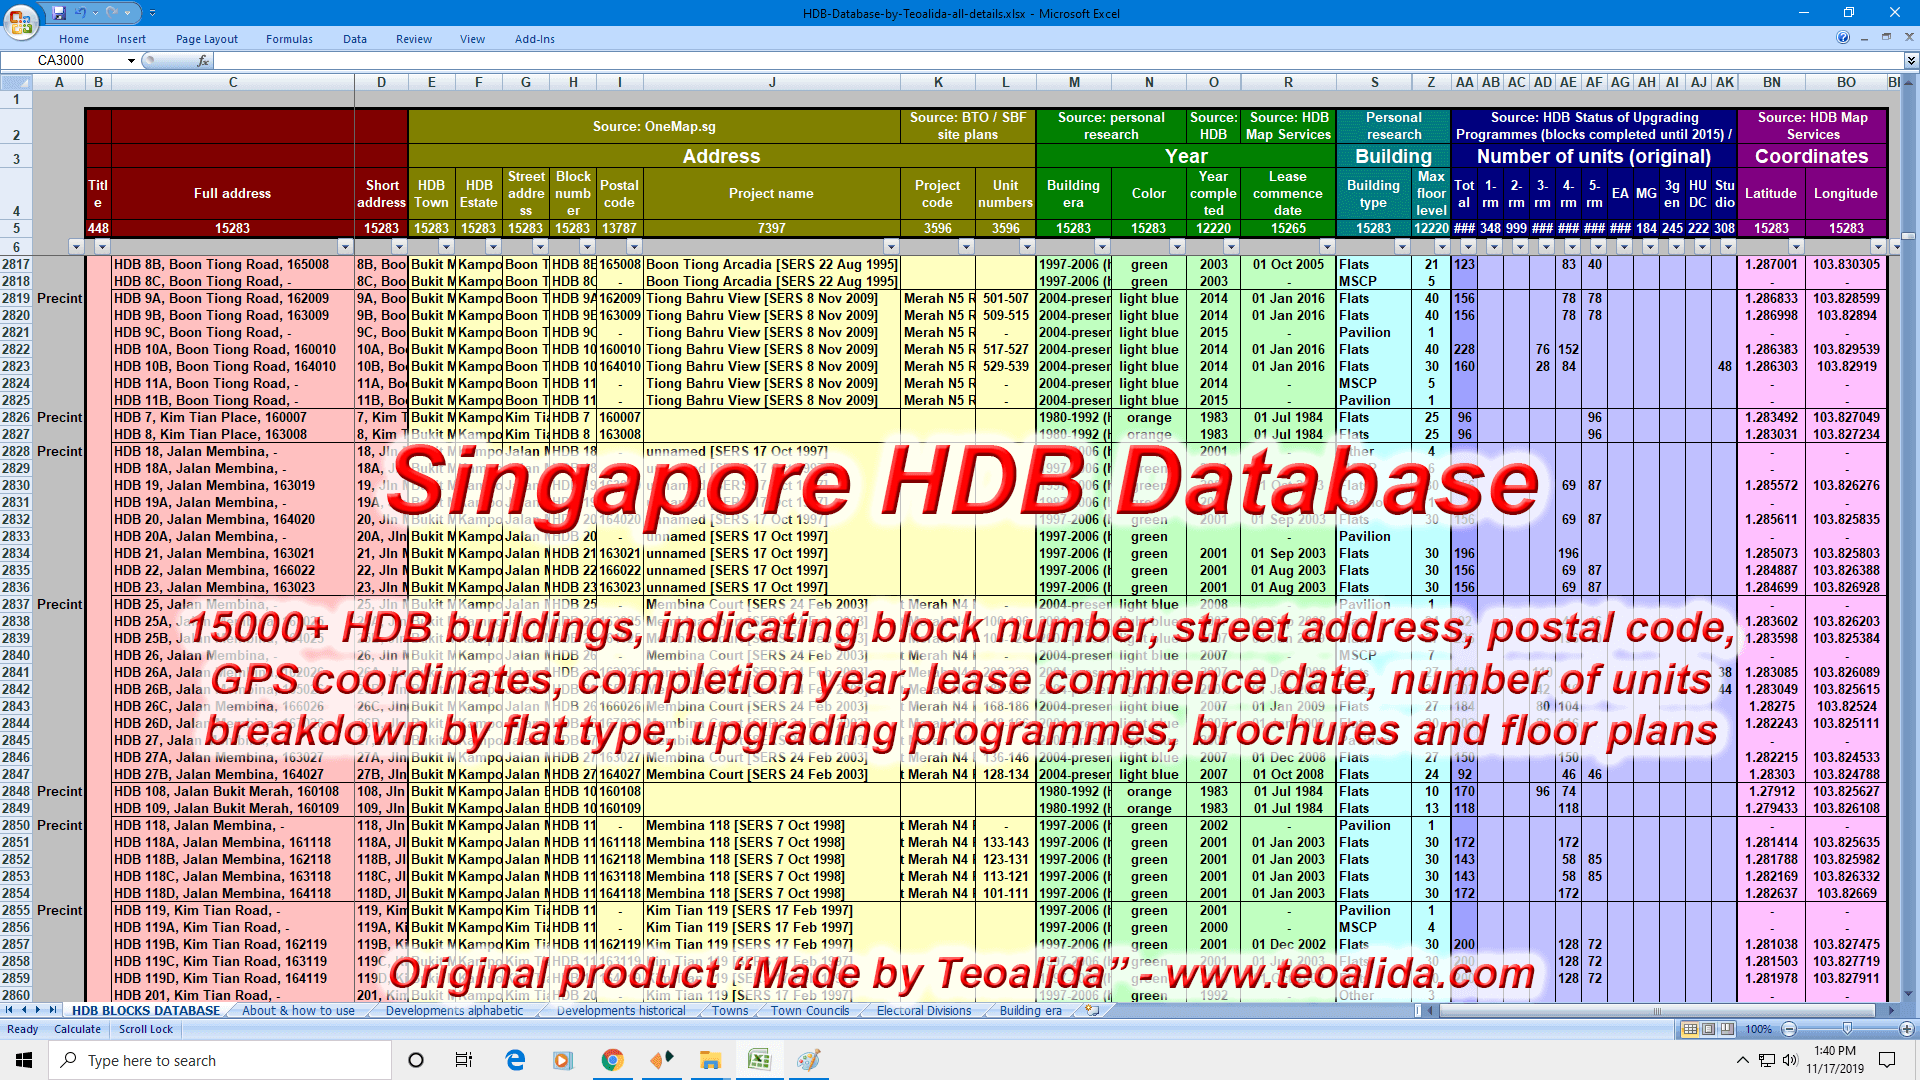 I have been collecting HDB data since 2009, making HDB Blocks Database in Excel, an original compilation “Made by Teoalida” which took over 500 hours of work. Collecting data from multiple sources, I manually entered data in one Excel table for all HDB blocks ever built in Singapore, indicating block number, street address, postal code, GPS coordinates, construction year, lease commence date, number of floors, number of units breakdown by flat type, upgrading programmes, brochures and floor plans. Since 2015 I sold Excel file to various companies.
I also collected over 1000 floor plans in PDF format from HDB’s Sale of Balance Flats. In 2009 I wrote HDB history & floor plans evolution 1930s-present which I updated in 2014 with new screenshots for ~70 floor plans that I though that are most common.
In July 2017 I made a drop down search to enquire information from HDB Database (one block at time).
I wanted for long time to display data in an interactive map, but I did not had sufficient technical knowledge to do this. Thanks to Sik Shu Wei who contacted me in August 2017, I saw a colored map on his website, he told me that made map with Google Fusion Tables, a FREE experimental application that provided only 9 colors of colored dots, as well as other icons representing various businesses. Sik Shu Wei map was only displaying lease commence date and colored blocks accordingly, it was a MESS because lease commence date is provided by HDB only for blocks available on resale market, so rental blocks and recent blocks under construction or under MOP were in same color on his map.
I made my own interactive map in September 2017 importing my very detailed HDB Database into Google Fusion Tables. Google announced closure of Fusion Tables on 3 December 2019, so in October 2019 I moved to ZeeMaps, a paid service that provide 31 colors to choose from, and ability to filter and display only blocks of specific criteria. If anyone thinks that is better to use different colors that indicate block types and construction years, please tell.
Is there such thing as a HDB block that has 1 floor only? I couldn’t find it.
If you are referring at legend showing one 1-floor block standing, that was an error, an 11-storey block appeared as 1-storey. But there have been 1-storey terraced houses built by SIT, now demolished (Bukit Panjang Estate, and maybe more)
Nice map