Map of HDB blocks – colored by year built
See alternative map colored by number of floors.
Rounded squares = standing and under construction, diamonds = demolished blocks.
As June 2024 the map contains 12867 residential buildings, with the following breakdown:
| Icon color | demolished blocks | standing blocks | blocks with floor plans |
|---|---|---|---|
| 4 | 0 | #DIV/0! | |
| 641 | 101 | 70.30% | |
| 441 | 229 | 96.51% | |
| 358 | 1756 | 88.72% | |
| 80 | 2467 | 97.77% | |
| 881 | 99.21% | ||
| 1016 | 95.77% | ||
| 671 | 77.20% | ||
| 1473 | 72.03% | ||
| 665 | 47.22% | ||
| 899 | 36.26% | ||
| 533 | 0.00% | ||
| 652 | 0.00% |
Ang Mo Kio, Bedok, Bishan, Bukit Batok, Bukit Merah, Bukit Panjang, Bukit Timah, Central Area, Choa Chu Kang, Clementi, Geylang, Hougang, Jurong East, Jurong West, Kallang/Whampoa, Marine Parade, Pasir Ris, Punggol, Queenstown, Sembawang, Sengkang, Serangoon, Tampines, Tengah, Toa Payoh, Woodlands, Yishun.
Instructions
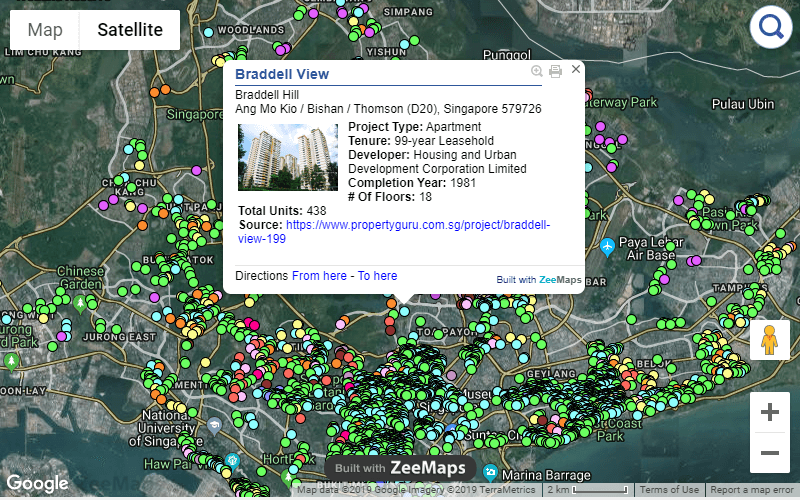
Click block markers on map to view year built, number of floors, number of units, upgrading programmes, typical floor plans, chances to get SERS, etc (one block at time).
Use search box inside map to navigate to a specific location, town, block number, street name or postal code.
Use filter boxes below map to show only blocks containing specific info. Search is instant so if you type 10-letter word you force map searching 10 times. For faster results try copy-pasting:
- Project name: type “BTO 2020” or “SERS 2003” to see projects sold via specific scheme in a specific year, or type a BTO name to see only it.
- Completion year: type a number to see blocks completed in specific year.
- Highest floor: type a number to see blocks of a specific number of floors.
- Number of units: type 1-room, 2-room, 3-room, 4-room, 5-room, executive, studio, etc, to see blocks having a particular flat type.
- Unit number: type stack 345, not #12-345 to see in which block is located (available for recent blocks, most blocks built before 2005 don’t have unit numbers in database).
- Possible floor plans: copy-paste URL of a floor plan to see in which blocks can be found, or “to be added” to see blocks without floor plans (you can contribute by sending me floor plans).
I can guarantee 100% accuracy for block numbers, street addresses, unit numbers, lease years, number of units breakdown by flat type, etc. Sources of each information is indicated HERE.
I cannot guarantee accuracy for floor plans, they being added from my personal research, so I need your help, please report wrong floor plans!
About me & history of HDB map
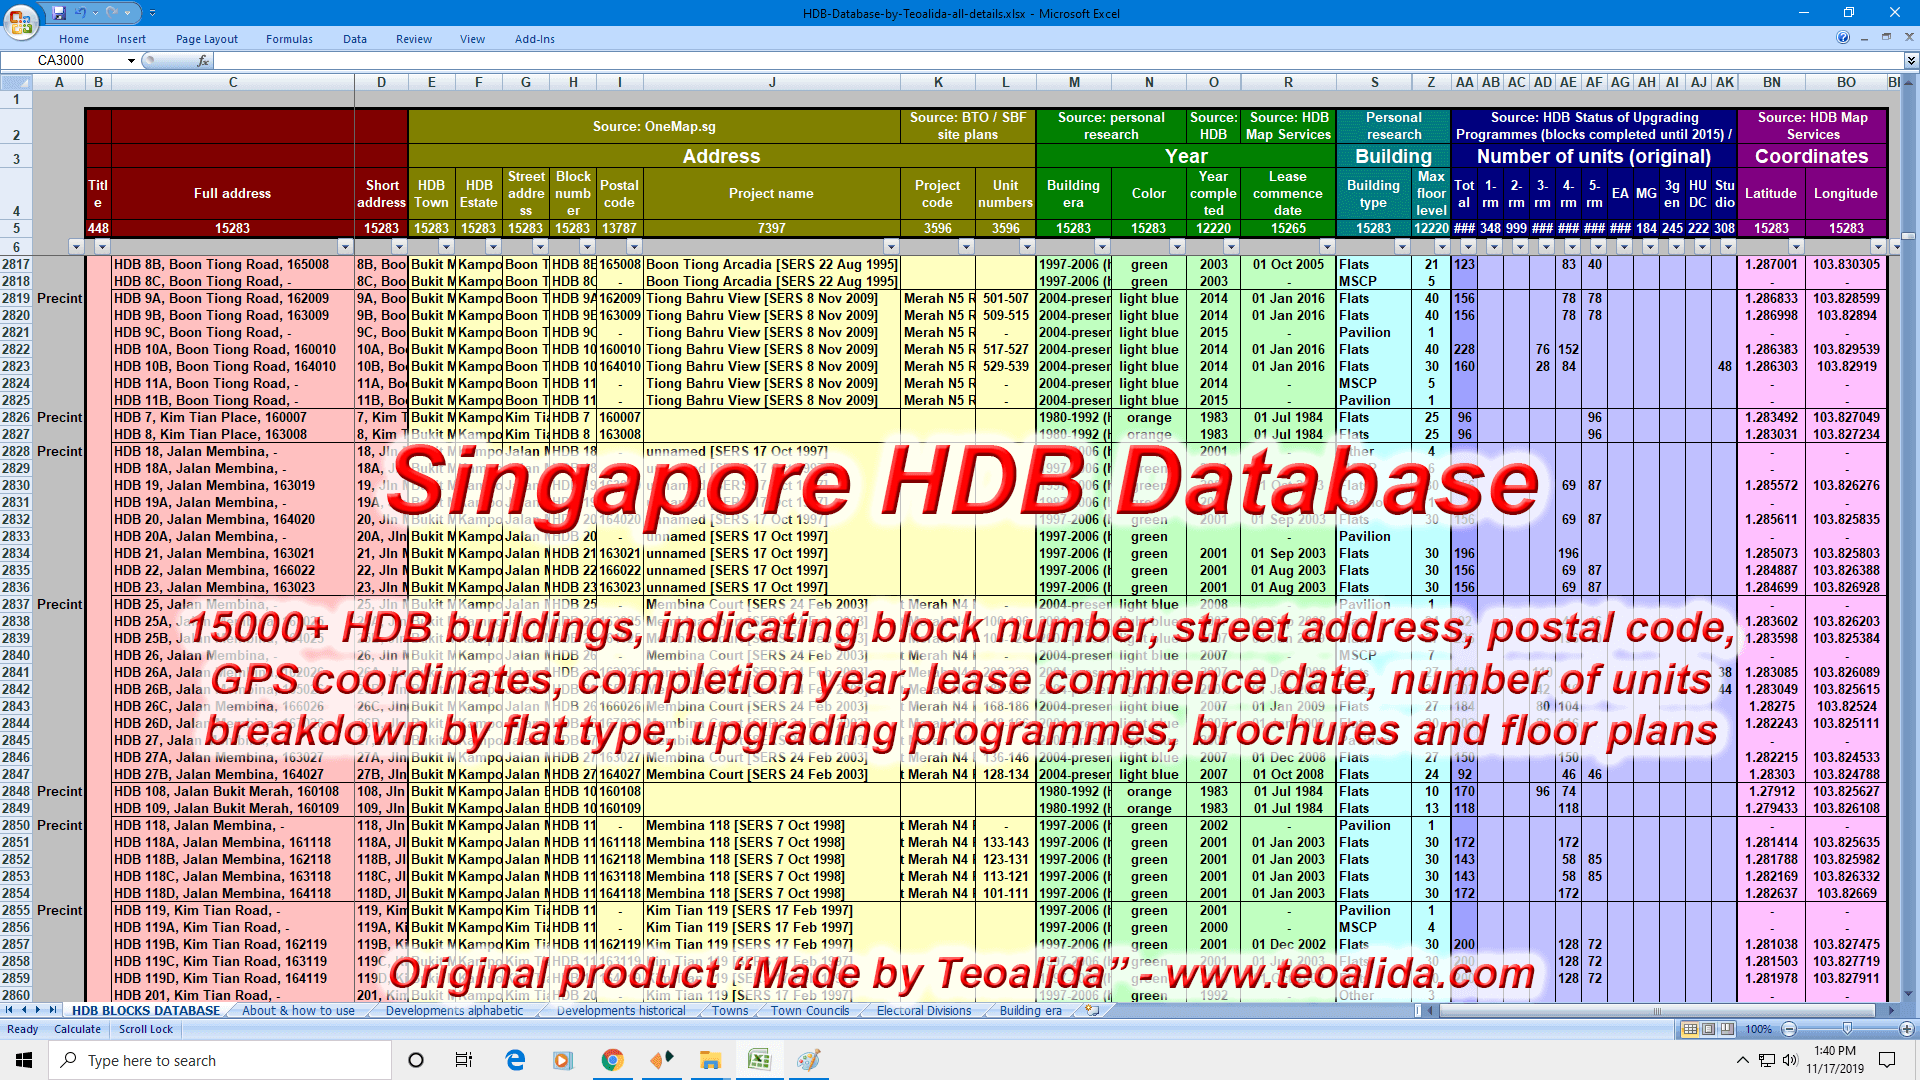 I have been collecting HDB data since 2009, making HDB Blocks Database in Excel, an original compilation “Made by Teoalida” which took over 500 hours of work. Collecting data from multiple sources, I manually entered data in one Excel table for all HDB blocks ever built in Singapore, indicating block number, street address, postal code, GPS coordinates, construction year, lease commence date, number of floors, number of units breakdown by flat type, upgrading programmes, brochures and floor plans. Since 2015 I sold Excel file to various companies.
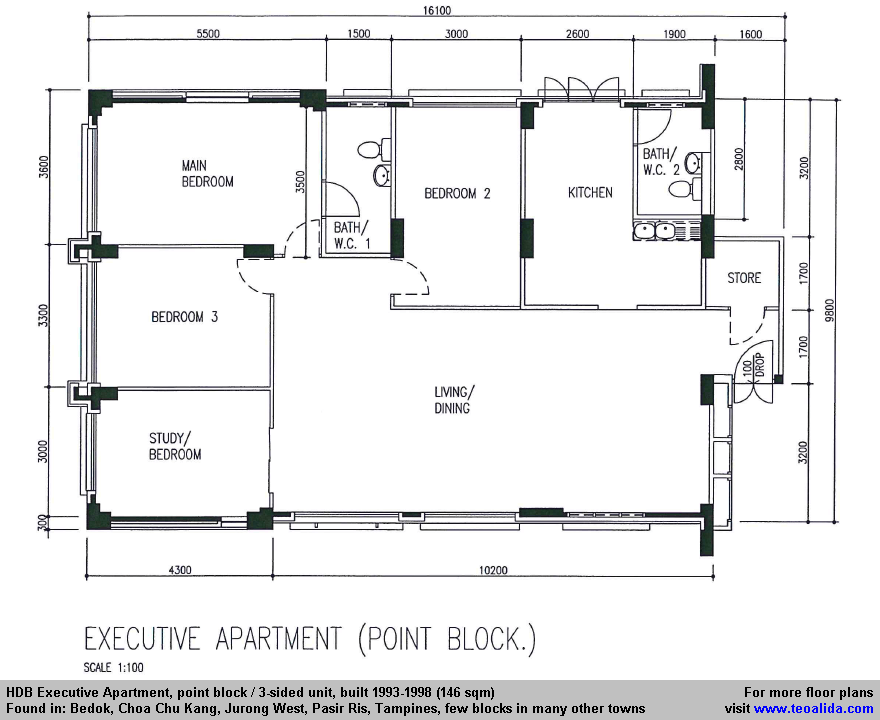
I also collected over 1000 floor plans in PDF format from HDB’s Sale of Balance Flats. In 2009 I wrote HDB history & floor plans evolution 1930s-present which I updated in 2014 with new screenshots for ~70 floor plans that I though that are most common.
In July 2017 I made a drop down search to enquire information from HDB Database (one block at time).
I wanted for long time to display data in an interactive map, but I did not had sufficient technical knowledge to do this. Thanks to Sik Shu Wei who contacted me in August 2017, I saw a colored map on his website, he told me that made map with Google Fusion Tables, a FREE experimental application that provided only 9 colors of colored dots, as well as other icons representing various businesses. Sik Shu Wei map was only displaying lease commence date and colored blocks accordingly, it was a MESS because lease commence date is provided by HDB only for blocks available on resale market, so rental blocks and recent blocks under construction or under MOP were in same color on his map.
I made my own interactive map in September 2017 importing my very detailed HDB Database into Google Fusion Tables. Google announced closure of Fusion Tables on 3 December 2019, so in October 2019 I moved to ZeeMaps, a paid service that provide 31 colors to choose from, and ability to filter and display only blocks of specific criteria. If anyone thinks that is better to use different colors that indicate block types and construction years, please tell.
I done a major update in 2018 adding in database links to those 70 popular floor plans screenshotted in 2014. However due inconsistent block model naming, just ~90% of 1960-1991 blocks and ~40% of 1991-2005 blocks had floor plans linked (some blocks did not showed floor plans when clicking even if they were identical with blocks in other town which showed floor plans).
In September 2021 I started another major update, I used ZeeMaps filter to show blocks without floor plans, helped me to harmonize block model naming and link floor plans where they were missing. I also took screenshots of few more PDFs to make PNG floor plans displayable on map. I also changed color legend and started adding coordinates for demolished blocks (if you don’t need them you can disable gray from legend).
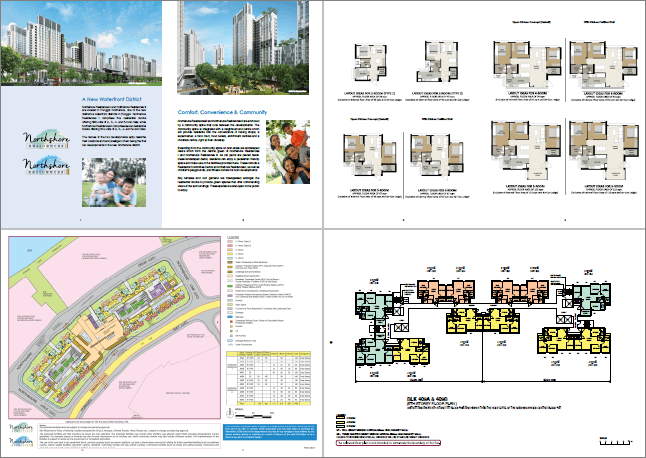
As 20 September 2021 I have floor plans for 96% of 1960-1991 blocks and 62% of 1991-2005 blocks. Since 1990s HDB started building many distinctive layouts thus it require more effort for me to link correct floor plans to correct blocks, all blocks completed after 2005 are designed uniquely (including BTO blocks launched since 2001), meaning that a floor plan for a BTO won’t match any other BTO, it is too difficult to find floor plans for EVERY unit in EVERY BTO, so I did not bothered adding individual unit floor plans with dimensions, instead I linked BTO brochures showing floor plans for whole block, without dimensions.
Update 5 October 2021: added coordinates for another 900 demolished blocks (almost all SIT/HDB/HUDC ever build) and floor plans for few dozens blocks.
Update 20 November 2021: added Nov 2021 BTO, privatization date for HUDC estates and colored them correctly if they are standing or demolished.
Update 27-30 May 2022: recolored from light blue to cyan 112 blocks which fulfilled MOP and are available on resale market during first half of 2022, updated upgrading programmes for pre-1980 blocks, will update 1980-2000 during next month (upgrading programmes info was not updated since 2015).
Update December 2022: I recreated maps in WP Go Maps (WordPress plugin) and deleted ZeeMaps.
Updates October 2023:
- I split “standing” category in 3 categories of construction years so you can filter map more accurately.
- Because number of cyan blocks grew as more blocks fulfilled MOP, I made 2 colors to make distinction between BTO launched in 2001-2010 and BTO launched after 2011. Once all BTO launched in 2014 fulfill MOP I re-organize as BTO era I (2001-2015 with income ceiling $8000-$10000) and BTO era II (2015-2024 with income ceiling $12000-$14000). The new classification Standard, Plus, Prime that will start in 2024 will make BTO era III.
- Added estimated completion date (at BTO launch) so you can compare with actual date of completion.
- Removed number of floors and units per floor to reduce number of text in info window. Most people come here looking for floor plans and if they click blocks on 1336×768 screen or mobile phones, some did not noticed that floor plans are available unless scrolled down info windows.
- Added icons with P for premium flats, also for DBSS and PLH.
In addition of major updates listed above, I also update with new BTO blocks when they are launched (BTO launches are usually in February, May, August, November).
I would want to express my gratitude to you for penning such an engaging article on the subject. This has given me a lot to think about, and I am looking forward to reading more.
Pato
Pa
Renata… Thank you for being FIRST customer purchasing the whole Singapore database!
Very helpful for me
Blocks 45, 48 & 49 Stirling Road are were the first few blocks of flats completed in October 1960, just months after the Housing and Development Board (HDB) was formed in February 1960.
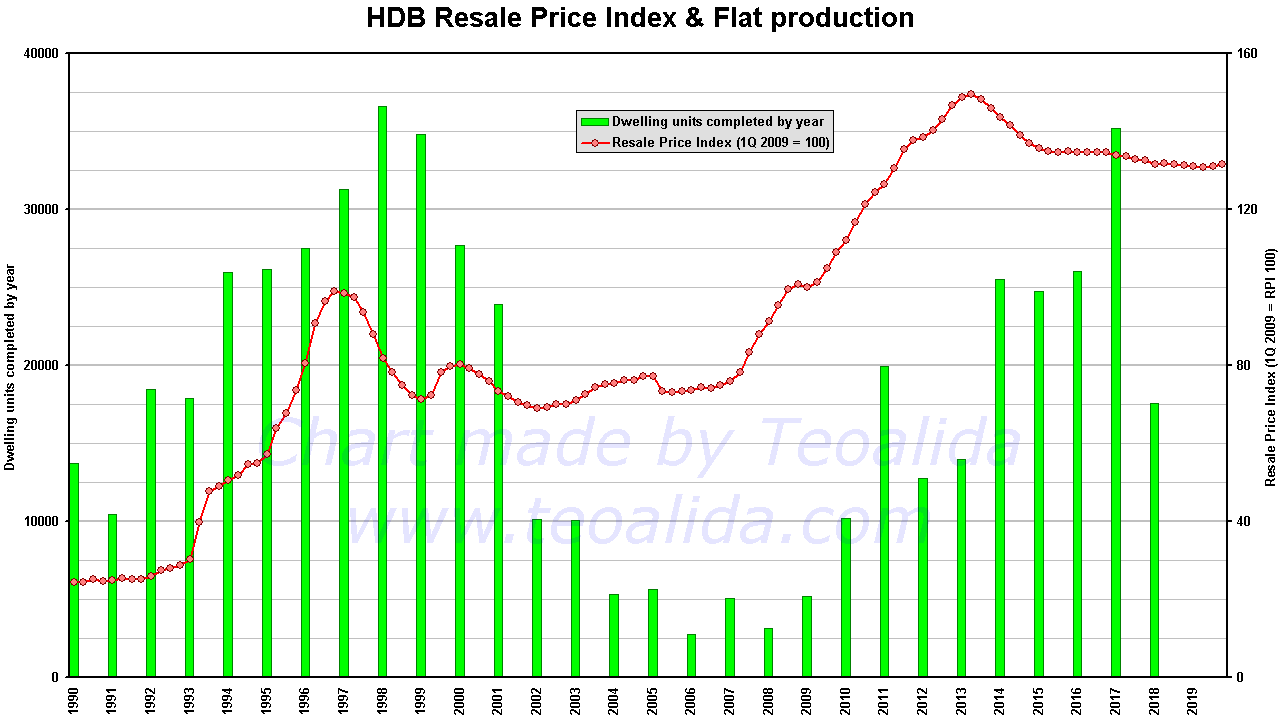
HDB price trends are influenced by various factors, including economic conditions, government policies, and market demand. Over the years, the Housing and
Development Board (HDB) in Singapore has implemented measures to ensure housing affordability and stability. I would want to express my gratitude to you for penning such an engaging article on the subject. This has given me a lot to think about, and I am looking forward to reading more. Additionaly, this website capture more on the case https://www.daffodilsw.com/ai-development-services/ checkout now.