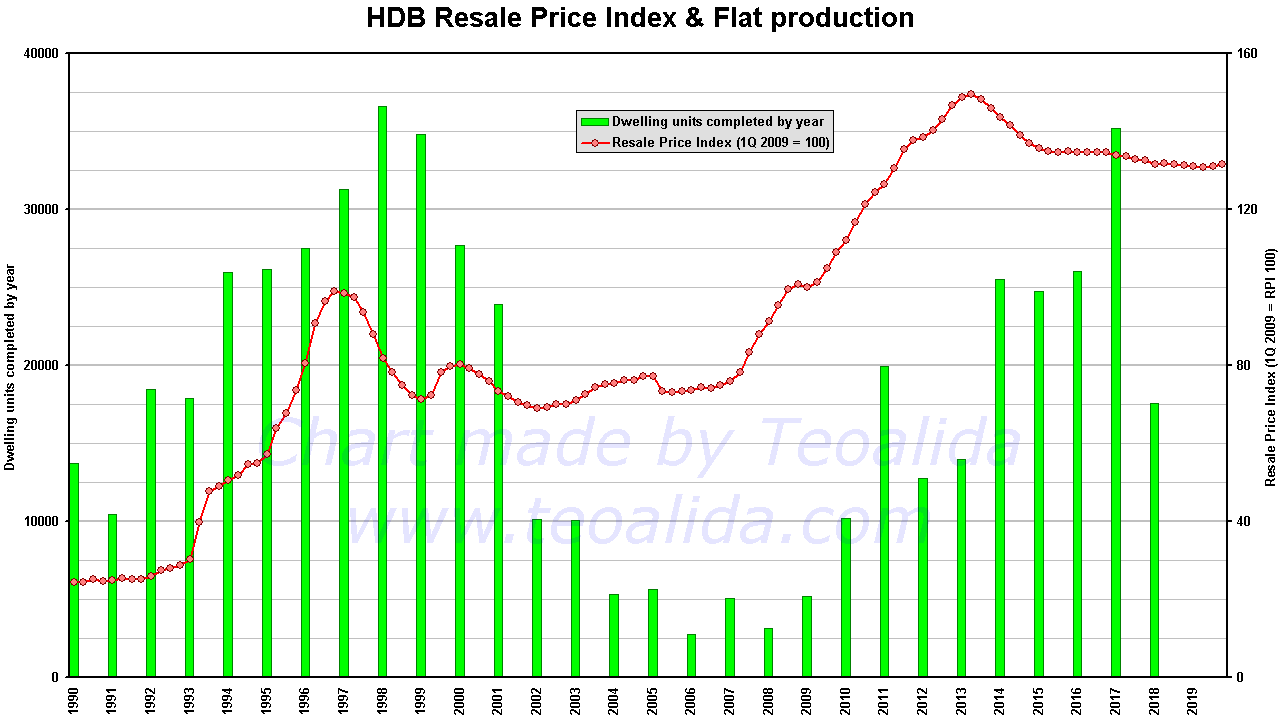
I compiled this Excel file summarized with data from Key Statistics section of HDB Annual Reports since 1990 and generated the below charts, showing yearly evolution of number of dwelling units by town and flat type. I update yearly in November when HDB publish Annual Report for past year.
What other statistical data would you like to see on this page? Leave a comment and tell me!
HDB Annual Reports having every table, last 5 years of Annual Reports can be viewed on HDB InfoWeb, and a friend went to National Library to take photos of older annual reports so I can transcribe every table in Excel.
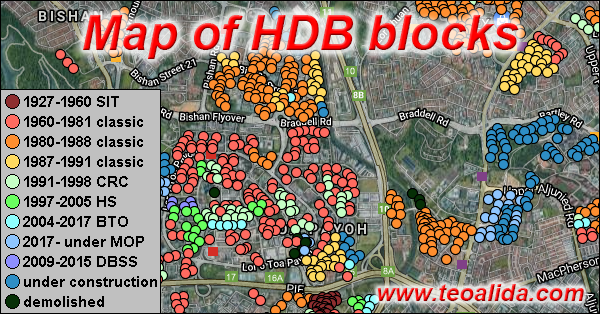
Database of HDB blocks detailed to block level. Including under construction blocks launched until November 2019 BTO and demolished blocks after 2010, there are 1,166,857 units in 10,757 blocks, averaging 108 units per block.
Number of dwelling units
Since its founding in 1960, HDB built 1,212,557 dwelling units and commercial properties by end-2019. Beside HDB, SIT built about 23,000 units between 1927 and 1959, HUDC built about 9,600 units in 1970s and 1980s, and JTC built somewhere around 10,000 – 20,000 units in 1960s and 1970. This makes around 1.25 million public housing units built.
Of them, 1,074,667 dwelling units are in use at 31 March 2020 according HDB Annual Report, about 130,000 dwelling units being demolished (clearance of rental blocks and SERS), converted (2 units joined into 1 unit), privatized (HUDC), etc. About 30,000 are commercial units.
Point mouse cursor on charts to see exact numbers.
The number of 1/2/3-room flats dropped during 1990s and 2000s because of demolition and conversion of smaller flats into larger flats. HDB stopped construction of 3-room flats in 1988 and resumed in 2001 in small numbers. 3-Room was introduced as mainstream supply in 2004 BTO.
HDB closed the registration queue for Executive flats in 1995, shortly after introduction of Executive Condominiums. Last EM was completed in 1998 and last EA in 2003, for people in the queue. The small growth of Executive flats after 2004 is from adjoining smaller flats.
Studio Apartments (35/45 sqm) were introduced in 1998 (first 6 Studio blocks were completed in 2001), they are restricted to elderly (55+ years old), 30-year leases and cannot be sold in resale market. 2-Room Flexi was announced on 19 August 2015, to replace Studio Apartments and 2-Room. The drop of Studio Flats after 2019 is because when owner dies, Studio Apartments are re-offered for sale as 2-Room Flexi.
Biggest HDB towns
Current town boundaries were introduced in Annual Report 1990. Bedok was the biggest town, overtaken by Tampines in 1996 then by Jurong West in 2000. We expected Sengkang to take the lead, but announcement of Tampines North estate in 2013 made Tampines leader again in 2022. Jurong West, Sengkang and Woodlands are in close battle for 2nd place.
National statistics
According SingStat, as 2018 the Singapore population is 5,638,700, of which 3,994,300 Residents (3,471,900 Singapore Citizens and 522,300 Permanent Residents).
According HDB Annual Report 2018, 3,247,500 Residents live in HDB apartments, this means 81% (non-residents are not allowed to own HDB apartments but they can live in apartments owned by a Resident spouse, also they are allowed to own apartments in private condominiums taller than 6 storeys but not landed houses or apartments in low-rise condominiums). This means average family size of 3.1 residents per apartment and 30 sqm per person. Note that HDB Annual Report shows same resident population since 2015 onward, based on older Annual Reports 2010-2014 average household size was around 3.4 residents per apartment so 27 sqm per person. For comparison, in 1968 were in average 6.2 people per apartment (average flat size I estimate around 40 sqm).
Many HDB owners are renting rooms or entire flat to foreigners, some HDB owners are citizens married with foreigners, HDB never provide official statistics about how many non-Residents does live in HDB apartments.
According Yearbook of Statistics 2010, Singapore population including non-residents is 5,076,700 living in 1,180,500 dwelling units (HDBs, condos, private flats, landed houses, others), of which 76.3% are HDBs, this means a nationwide average of 4.30 people per dwelling unit, if the average would be same for HDB, it would mean 22 sqm per person (no newer statistics available for non-residents).
Average household size for each flat type and race can be seen on www.singstat.gov.sg > Key Indicators and Sample Household Survey. You can see that households with 6 or more persons represent 10% of Chinese households and 23% of Malay households.
Home ownership of HDB flats reached the peak of 94% in 2002, then slowly felt down to 90% in 2011 and been constant to 2018.
HDB dwelling units under management, as 31 March 2022
| Town | 1-Room | 2-Room | 3-Room | 4-Room | 5-Room | Exec / MG | Studio | Total |
|---|---|---|---|---|---|---|---|---|
| Ang Mo Kio | 1,314 | 3,807 | 24,515 | 14,715 | 6,150 | 502 | 307 | 51,310 |
| Bedok | 2,604 | 3,055 | 23,015 | 21,971 | 10,773 | 2,718 | 279 | 64,415 |
| Bishan | 564 | 264 | 2,357 | 9,359 | 5,716 | 1,660 | 152 | 20,072 |
| Bukit Batok | 919 | 3,676 | 11,754 | 18,483 | 7,786 | 2,734 | 233 | 45,585 |
| Bukit Merah | 4,665 | 6,083 | 15,975 | 17,190 | 9,621 | 47 | 576 | 54,157 |
| Bukit Panjang | 223 | 1,230 | 3,868 | 17,224 | 10,628 | 3,381 | 342 | 36,896 |
| Bukit Timah | 49 | 439 | 920 | 683 | 380 | 83 | 2,554 | |
| Central Area | 2,075 | 1,316 | 4,262 | 3,438 | 904 | 6 | 12,001 | |
| Choa Chu Kang | 565 | 1,368 | 2,463 | 23,465 | 15,952 | 4,762 | 451 | 49,026 |
| Clementi | 474 | 770 | 12,100 | 9,397 | 3,364 | 625 | 26,730 | |
| Geylang | 879 | 3,661 | 12,022 | 10,221 | 3,594 | 832 | 305 | 31,514 |
| Hougang | 668 | 2,458 | 11,004 | 27,306 | 11,210 | 4,311 | 600 | 57,557 |
| Jurong East | 433 | 529 | 7,069 | 8,188 | 5,925 | 1,871 | 107 | 24,122 |
| Jurong West | 813 | 2,692 | 12,616 | 29,761 | 22,215 | 6,507 | 602 | 75,206 |
| Kallang / Whampoa | 4,401 | 2,831 | 14,169 | 12,476 | 5,478 | 504 | 312 | 40,171 |
| Marine Parade | 1,350 | 3,027 | 1,798 | 1,682 | 7,857 | |||
| Pasir Ris | 176 | 348 | 491 | 11,641 | 9,379 | 7,460 | 159 | 29,654 |
| Punggol | 1,366 | 4,872 | 5,708 | 24,632 | 17,704 | 1,126 | 403 | 55,811 |
| Queenstown | 575 | 3,968 | 16,204 | 10,530 | 4,337 | 356 | 408 | 36,378 |
| Sembawang | 955 | 3,493 | 1,705 | 12,250 | 9,056 | 2,871 | 30,330 | |
| Sengkang | 685 | 3,268 | 4,161 | 32,153 | 24,728 | 4,463 | 731 | 70,189 |
| Serangoon | 272 | 409 | 4,531 | 10,231 | 3,759 | 2,365 | 65 | 21,632 |
| Tampines | 1,615 | 1,517 | 14,274 | 32,050 | 19,373 | 5,849 | 664 | 75,342 |
| Tengah | 0 | 0 | 0 | 0 | 0 | 0 | 0 | 0 |
| Toa Payoh | 1,170 | 4,231 | 16,484 | 12,668 | 6,412 | 854 | 366 | 42,185 |
| Woodlands | 2,274 | 2,957 | 7,131 | 29,899 | 20,791 | 6,191 | 829 | 70,072 |
| Yishun | 1,259 | 2,968 | 16,057 | 31,334 | 10,521 | 2,741 | 734 | 65,614 |
| Total | 30,944 | 63,170 | 247,401 | 433,300 | 247,741 | 65,116 | 8,708 | 1,096,380 |
Despite of shrinking flat sizes in late 1990s, average flat size has increased until 2005, reaching about 95 sqm, thanks to demolition of small 1/2/3-room flats built in 1960-1970s and building 90-140 sqm flats, also due to Main Upgrading Programme that add 5 sqm utility rooms. After 2005 average flat size is slowly falling down because HDB stopped supply of Executive, reduced supply of 5-room, and reintroduced 1-room, 2-room and 3-room flats. As 2018, average flat size of existing flats stock is 93.02 sqm.
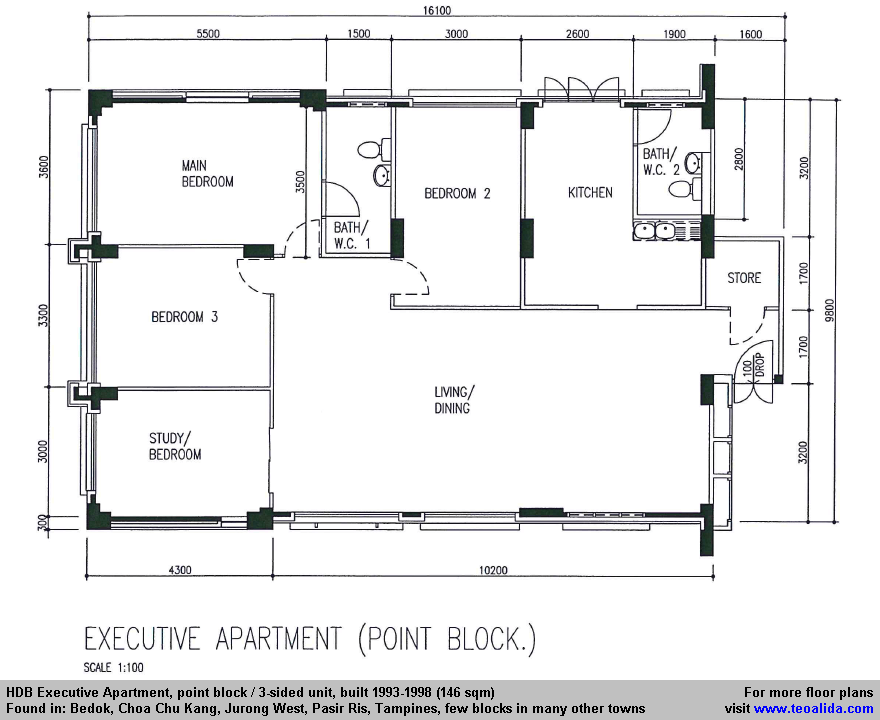
New flats launched via BTO since 2011 and completed from 2015 onward are about 80 sqm in average, for comparison the flats build in mid-1990s were about 120 sqm in average, a world record for public housing. Read more: HDB Flat Size analysis.
Sources:
– SingStat for the population.
– HDB Annual Reports for the number of flats (units).
– HDB Resale Flat Prices database 2013-2017 (89538 records) for estimating average size of each flat type.
The average flat size may be a bit inaccurate because the resale flat prices database include only sold flats, there is no info about the size of rental 1/2-room flats, and does not include flats built last 5 years which are under minimum occupation period, which are smaller than average size of older flats.
Private housing statistics
singstat.gov.sg allow you to generate tables, such as Resident Households By Type Of Dwelling year by year from 1980 to present. As 2018, out of 1,325,300 Resident households, 1,043,300 HDB, 210,300 condos, 67,900 landed, 3,800 other. Non-Resident households are not included here (many condos are owned by foreigners).
Singapore in Figures 2017.pdf shows on page number 16 (18th page in file) total residential dwellings 1,370,319, private residential landed 72,595, non-landed 275,485 (as 2016).
HDB flat size statistics based on resale transactions
I have database of HDB Resale Flat Prices 1990-2017 and analyzed data in Excel. Here are the results:
As country level: the average flats size is 95.45 sqm (average of 767528 transacted units).
As town level: Pasir Ris New Town (built between 1988 and 1996) have the biggest flats, 123.62 sqm (average of 28469 units) Central Area (most built in 1970s) have the smallest flats, 71.52 sqm (average of 5893 units).
As neighborhood level: Pasir Ris 2XX neighborhood have the biggest flats, 132.74 sqm (average of 4363 units), Pasir Ris 5XX have 129.24 sqm (average of 4689 units), Pasir Ris 6XX have 126.89 sqm (average of 2742 units), Choa Chu Kang 5XX have 125.87 sqm (average of 3363 units), Tampines 3XX have 122.58 sqm (average of 6022 units).
Note that the average size of resold flats is slightly bigger than the real average flat size, because the big and <10 year old flats tends to change their owners more frequently than the small old flats owned mainly by elderly, also some of the small flats are rented from HDB rather than owned, so they never appear in resale transactions.
Hi,
What is the data source of “Number of dwelling units” Figure and does this only count HDB units or also landed properties and condominiums?
Thanks,
Yanis
All sources are indicate within article text.
All sources are indicated within article text.