 For latest statistics se https://gs.statcounter.com/screen-resolution-stats/desktop/worldwide/
As graphic designer and enthusiast in computer history, I became curious how the monitor dimensions evolved over the years and analyzed which screen resolutions were most popular, so I created below Excel files:
Monitor size calculator .XLS – Excel table that calculate monitor dimensions (width and height) in mm, screen area, pixels size, etc. I made to display all monitor sizes from 14 to 40 inch, but you can write your own numbers.
Screen resolution statistics .XLS – Source of data:
W3Counter – since May 2007, sample: 80,000+ sites using their services according real-time counter in footer.
NetMarketshare – since November 2007, 40,000 sites, 160 million unique visits according FAQ.
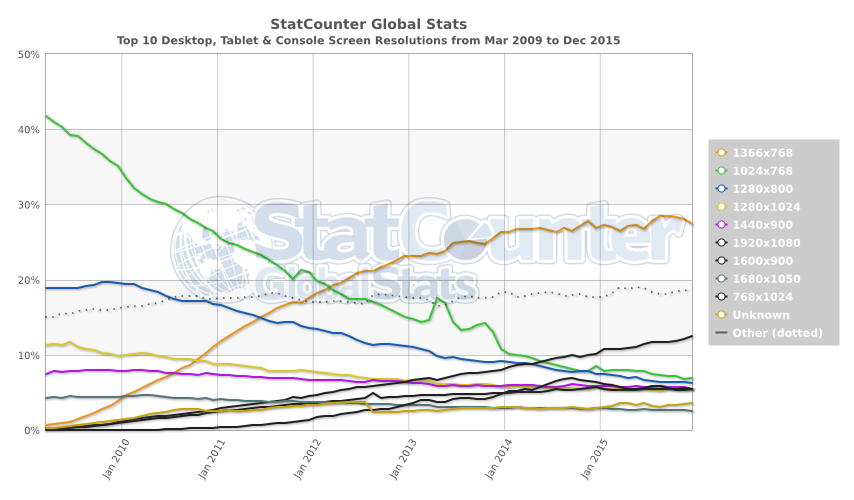
StatCounter – since March 2009, sample: 3+ million sites using their services according FAQ.
Screen resolution by country .XLS – Source of data: StatCounter only.
I made this analysis in 2014, I wanted to buy a new monitor to replace a 9-year old 17″ LCD and got interested in researching screen resolution evolution over history.
First time I used W3Counter, then I found the highly-detailed StatCounter with its ability to download CSV, but I was not happy of historical coverage being 2009-present only, then I found NetMarketshare. I copied monthly data in an Excel table (the process took few hours) then I analyzed it, made charts about evolution of screen resolutions, etc. Then compiled the summarized table shown below in this page (most popular screen resolutions). I tried to find detailed statistics going back to 2003 at least to study the origins of widescreen bullshit, but no such thing is available.
I updating monthly until January 2015. Lack of comments on this page and lack of positive chat messages from website visitors, gave me impression that nobody is interested in my analysis. I updated for last time in January 2016.
In 2017 StatCounter was redesigned and there is no longer possible to download full data in CSV format with one column for resolution and one row for each month, clicking “download CSV” show now only top 20 resolutions for whole period selected. NetMarketshare also removed screen resolution stats during 2017 or 2018. Even if I want to update above Excel files, I cannot do anymore, except W3Counter.
Additional stats for enthusiasts of computer history:
W3Schools – 2000-present stats but not detailed and unreliable (traffic of their own site only, high-end internet users).
onestat.com – 2002-present press releases, showing that 1280×800 was non-existent in 2004.
utexas.edu – 2004-2006, very small traffic sample, about 10.000 monthly visitors of their university site, exact percentages are not relevant, but it show when widescreens appeared: in March 2004 report 1280×800 had 0.49% and 1440×900 had 0.38% while in December 2005 report 1440×900 and 1680×1050 were still rare (1%) but 1280×800 laptops gained significant marketshare (7.58%).
Summary
800×600 was most popular screen resolution having a market share 56% in 2000 and was overtaken in 2003 by 1024×768 which reached a peak of 57% market share in 2006 (according W3Schools).
1024×768 had over 50% marketshare before 2007 and was overtaken by 1366×768 in March 2012 which reached a peak of 27%+ in 2015. Next popular were 1280×800 with a peak of 19.72% in Nov 2009 and 1280×1024 with peak in 2007 (according StatCounter).
Note: in United States and some European countries 1280×800 was most popular for a short period in 2009-2011 because people buy new laptops and throw away older 1024×768 laptops to poorer countries.
Today trend is towards 1920×1080 which already became dominant in South Korea (2013), Germany and China (2015). At worldwide level 1920×1080 exceeded 1366×768 in late 2020.
History of screen resolutions
CRT monitors retain their sharpness at any resolution, this is why you can see some high-end CRTs capable of high resolution. For example 21″ CRTs can display 1600×1280 or 1800×1440 but you would prefer to use 1280×1024 to make text readable. 2048×1536 is the maximum resolution supported by VGA cable, thus CRT monitors were produced up to this resolution.
LCD monitors offer a sharp image only at native resolution, so they were produced with pixel size 0.25 – 0.30 mm. Making LCD with smaller pixels would make text too small and unreadable at native resolution, or blurry if you set a lower resolution.
During 1990s LCD displays were expensive so they were found only in laptops. Most people had CRT monitors and ran them in resolutions like VGA 640×480, SVGA 800×600, XGA 1024×768, but no exact statistics are available. Games like Age of Empires (1998), Midtown Madness (1999), The Sims (2000) had support only for these 3 resolutions. 1980s computers with CGA (320×200) and EGA (640×350) still existed, but they were not used to access internet to be tracked by statistics.
LCD monitors outsold CRT monitors in 2003, their typical size was 14″ / 15″ 1024×768 (4:3), 17″ / 19″ 1280×1024 (5:4), 21″ 1600×1200 (4:3 again).
A type of widescreen existed in 2003, 20″ 1600×1024.
The popular widescreen format (16:10) appeared in 2004 originally in laptops (14″ / 15″ had 1280×800, 17″ had 1440×900), next year desktop monitors appeared in this format (19″ 1440×900, 22″ 1680×1050, 24″ 1920×1200) and high-end laptops received such resolutions. Widescreen monitors come with VGA and DVI ports, running 4:3 resolutions on VGA cable will make image stretching on full screen, while DVI cable maintain aspect ratio and display black bars.
Television industry adopted 16:9 standard in 2008, and because is cheaper to produce both monitors and TV with same aspect ratio, 14″ / 15″ laptops became 1366×768, 17″ laptops became 1600×900, high-end laptops ($1000+) used 1920×1080. New desktop monitors were 18.5″ 1366×768, 20″ 1600×900, 21.5″ / 23″ 1920×1080. QHD, 27″ 2560×1440 appeared in 2009. LG G3 was in 2013 first smartphone with QHD display. Mini-laptops with 10″ screens used 1024×600, called netbooks (smaller than 14-17″ notebooks).
You may say that was logical to make 1280×720. The 1366×768 resolution was born because some software need minimum 1024×768 to run. It is considered the worst resolution ever as its width is not even divisible by 8, so a 1360×768 was also born.
A trend of high DPI display was started in 2011 when Apple launched Retina display, which doubles number of pixels while keeping the size of screen elements. PC monitors and laptops did not adopt this trend quickly because of poor Windows scaling, certain elements retain their original size when you set screen scaling.
As 1080p video format became popular, 1920×1080 screens started being available in mid-range laptops too ($500-$1000), 1600×900 disappeared.
Ultrawide monitors with approximately 21:9 aspect ratio appeared in 2013 as 29″ 2560×1080 and in 2014 as 34″ 3440×1440.
UHD, ultra high resolution, 3840×2160, popularily known as 4K, appeared in 2014 for high-end monitors but also laptops, using scaling is a MUST. They require HDMI or DisplayPort. Sony Xperia Z5 Premium (2015) was first smartphone with 4K screen, having 806 pixels per inch. This is a marketing hype, human eye cannot see more than 300 pixels per inch so putting more pixels have no use, it only drain battery faster.
Note: few users had 1366×768 before being adopted by TV in 2008, compared with popular belief 1366×768 did not appeared in 2008, HD TVs with 1366×768 capable to display 720p video but also output 1024×768 from computers, existed in 2000s.
Carmack coded Quake game on a 1920×1080 16:9 CRT monitor in 1995. Incredible but true, considering that widescreens (re)appeared in 2004 with 16:10 both CRT and LCD. Does anyone know who was the first inventor of 16:9?
The SAD part is that cheaper 16:9 monitors leaded to extinction of 4:3, 5:4 and 16:10 monitors around 2011. The stores bought what was the cheapest and the population was forced to buy what the stores sell, giving to manufacturers a false impression that nobody like 4:3 anymore.
Most popular screen resolutions and their peak markeshare
| Resolution | Aspect ratio | Peak W3Counter | Peak Net Marketshare | Peak StatCounter | Devices |
| 640×480 VGA | 4:3 | 1990s computers | |||
| 800×600 SVGA | 4:3 | 1990s computers | |||
| 1024×768 XGA | 4:3 | 50%+ pre-2007 | 50%+ pre-2007 | 40%+ pre-2008 | 14″, 15″ monitors (1990s – 2007) 14″, 15″ laptops (early 2000s – 2007) |
| 1152×864 XGA+ | 4:3 | 4%+ pre-2007 | 3.2%+ pre-2007 | 3.3%+ pre-2008 | No device have this as native resolution |
| 1280×960 SXGA- | 4:3 | 1.09% Jan-Apr 2009 | 0.95% Jun 2009 | 1.22% Jun-Jul 2009 | No device have this as native resolution |
| 1280×1024 SXGA | 5:4 | 17.25% Aug-Sep 2007 | 13%+ 2007 | 11%+ pre-2008 | 17″, 19″ monitors (1990s – 2011) High-end laptops (early – mid 2000s) |
| 1400×1050 SXGA+ | 4:3 | 1%+ pre-2007 | 0.8%+ pre-2007 | 0.4%+ pre-2008 | High-end laptops (mid 2000s) |
| 1600×1200 UXGA | 4:3 | 0.71% Mar 2009 | 0.35% Jun 2009 | 20″, 21.3″ monitors (1990s – late 2000s) High-end laptops (mid 2000s) | |
| 1600×1280 unnamed | 5:4 | CRT monitors only (early 2000s) | |||
| 1800×1440 unnamed | 5:4 | CRT monitors only (early 2000s) | |||
| 1920×1440 unnamed | 4:3 | CRT monitors only (early 2000s) | |||
| 2048×1536 QXGA | 4:3 | CRT monitors only (early 2000s) | |||
| 1280×768 WXGA | 5:3 | 1.58% Aug 2009 | 1.83% Jul 2009 | 1.98% Sep 2009 | Few laptops (mid-2000s – 2009) |
| 1280×800 WXGA | 16:10 | 20.43% Aug 2009 | 20.81% Jun 2009 | 19.72% Nov 2009 | 13.3″, 14.1″ laptops (2004 – 2009) |
| 1440×900 WXGA+ | 16:10 | 8.73% Jul 2009 | 9.06% Sep 2009 | 7.97% Oct 2009 | 19″ monitors (2004 – 2011) 14.1″, 15.4″ laptops (2004 – 2009) |
| 1600×1024 WSXGA | ~16:10 | 20″ monitors (2003 – 2004) | |||
| 1680×1050 WSXGA+ | 16:10 | 9.73% Jul 2009 | 5.81% Jul 2009 | 4.60% Mar 2010 | 22″ monitors (2004 – 2011) 15.4″, 17″ high-end laptops (2005? – 2009) |
| 1920×1200 WUXGA | 16:10 | 2.05% Jul, Sep 2009 | 2.26% Dec 2009 | 1.36% Mar 2010 | 24″ monitors (2004 – 2011) 15.4″, 17″ high-end laptops (2005? – 2009) |
| 2560×1600 WQXGA | 16:10 | 0.16% (Jun 2014) | 0.04% 2013-2014 | 30″ monitors (2006? – present) | |
| 1024×600 WSVGA | ~17:10 | 2.21% Oct-Nov 2011 | 1.63% Jan, Dec 2013 | 2.41% Aug 2011 | 10.6″ netbooks (2008 – present) |
| 1280×720 HD | 16:9 | 1.84% Sep 2014 | 1.8%+ (present) | Unknown devices (mid 2000s – present) | |
| 1360×768 WXGA | ~16:9 | 1.44% Feb 2013 | 2.72% Aug 2011 | Unknown devices (mid 2000s – present) | |
| 1366×768 WXGA | ~16:9 | 21.21% Nov 2014 | 17.51% Sep 2014 | 28.45% Aug 2015 | 18.5″ monitors (2008 – present) 13.3″, 14″, 15.6″ laptops (2008 – present) |
| 1600×900 HD+ | 16:9 | 4.72% Oct 2014 | 5.75% Jul 2014 | 5.7% Dec 2014 | 20″ monitors (2008 – present) 17.3″ laptops (2008 – present) |
| 1920×1080 Full HD | 16:9 | 8%+ (present) | 9%+ (present) | 12%+ (present) | 21.5″, 23″ monitors (2008 – present) 15.6″, 17.3″ high-end laptops (2008 – present) |
| 2560×1440 Quad HD | 16:9 | 1.2%+ (present) | 1%+ (present) | 27″ monitors (2010 – present) | |
| 3840×2160 Ultra HD | 16:9 | 28″ monitors (2014 – present) |
Note: reported screen resolution does NOT reflect monitor sizes. You can see in the above table 1152×864 (peak 3%+) and 1280×960 (peak 1.22%), despite that NO monitors were manufactured with this size. This indicate that many people set the monitor at lower resolution than native resolution.
On Windows 10 when you select 1920×1080 it sets scaling 125% automatically and browser report a resolution of 1536×864. Many people don’t bother changing default scaling, or do not like to have things so small on screen.
While Internet Explorer and Chrome report Windows resolution and scaling, regardless of the browser zoom, Firefox browser report resolution based on the zoom you choose in browser. It cause webmasters to see a lot of odd resolutions.
Tracking marketshare of 3840×2160 monitors is even more difficult, because most people use them with scaling 150% or 200% and browser reports them as 2560×1440 or 1920×1080.
Country stats
StatCounter allow you to filter data by every country, I found few interesting facts about different dominant resolutions:
In United States, 1024×768 lost the lead in Nov 2010 in favor of 1280×800 then in July 2011 was overtaken by 1366×768. 1920×1080 reached 11%+ in Dec 2014.
In United Kingdom, 1024×768 lost the lead in Aug 2009 in favor of 1280×800 then in May 2011 was overtaken by 1366×768. 1920×1080 reached 10%+ in Dec 2014.
In India, 1024×768 lost the lead in May 2012 in favor of 1366×768 which reached 40%+ market share in 2014. FULL HD 1920×1080 penetration is only 3% (poor people buy cheapest monitors and don’t care about size).
In Iraq, 1366×768 reached a huge 60%+ marketshare. Beside 1024×768 and 1280×800, no other resolution ever exceeded 7%. 1920×1080 is only 1.2%.
Biggest computer screens were in Switzerland (until 2012), highest share of big monitors, 1920×1200 reaching 5%+, 1680×1050 reaching 12%+, etc, much higher than Europe average (1.86% and 7.4%). Since 2013 South Korea, the world leader in TV and monitor manufacturing, took the lead, the FULL HD 1920×1080 is dominating with an impressive 40%+ market share in late 2013 (the quick rise compared with other countries sounds for me an error in counting stats). Japan is the second.
Surprisingly, Russia have bigger screens than United States or United Kingdom, 1280×1024 dominated from 2009 to 2012, having over 30% marketshare in 2009 while 1280×800 never exceeded 17% (probably laptops are unpopular there, 17″ and 19″ monitors imported as second hand from Western Europe, and they run at native resolution).
Smallest computer screens were in Somalia, and currently in Pakistan, where 1024×768 still dominate as 2014, and 1920×1080 reached only 0.9% at end of 2014.
If in Europe and USA 16:10 resolutions reached the peak in 2009, in Morocco, Egypt and Pakistan they are still growing as 2014, even 1280×1024. Probably this is the place where our old monitors go.
For more interesting facts see Screen resolution by country .XLS.
The monitors I used myself
In early 2000s I had a 17″ CRT, in 2005 I bought a LCD 17″ 1280×1024 but I ran most of time at 1024×768. It started flickering in 2014 so I had to replace it, I started researching computer history and I wrote this article. I wanted a bigger 4:3 monitor and I was shocked to discover that they are no longer produced. Initially I rejected idea to buy an 1920×1080, my favorite game The Sims 2 support resolutions up to 1600×1200.
So, I bought a 20″ 1600×1200 with PVA panel from a shop selling used computers, it had a vertical line of pixels getting stuck randomly so I exchanged with a 24″ 1920×1200 also PVA panel. Shortly after this I realized that I can hack The Sims 2 settings and set any resolution I want. The 24″ 1920×1200 monitor broke after 1.5 years, luckily it was still in warranty and I got a replacement of same size but with shitty TN panel. I realized that should have purchased a new 1920×1080 from start.
Looking for an IPS display and having much higher budget now, I decided to buy a new monitor, 27″ 3840×2160, $600, which I am running most of time with scaling 200%, but occasionally changing scaling to 100% or 150%.
In short, I accepted the switch to 16:9 just because this is the standard, NOT because I like it.
So where this 16:9 came from? It do not have significant history in computer or movies, it was chosen in 2008 as compromise format between the formats used by European movies (1.66:1) and American movies (1.85:1). But to be honest, 4:3 and 16:10 look much better in numbers. Several people attempted making petitions to standardize movie industry to 16:10 instead of 16:9.
People who watch movies often or play shooter games where FOV is important may like a wider screen, but I am not among them. As a professional, working often in AutoCAD, Word, Excel, Photoshop, a bit of coding, etc, I do not really find useful the extra width. Vertical space is more important. For certain projects I even put monitor in portrait mode.
If I was the person inventing computers, here are the resolutions I would have produced: square 17″ 1280×960, 20″ 1600×1200 and wide 20″ 1600×1000, 24″ 1920×1200, 30″ 2560×1600 and 3 laptop types: 12″ 1024×768, 14″ 1280×800, 17″ 1600×1000 (both 4:3 and 16:10, so people could choose, no 16:9 bullshit).
Personal experience as graphic designer
Responsive websites that adjust automatically to any screen resolution are getting popular, but a lot of other things, such as image resolution cannot be changed without loss of quality, so dimensions of images need to be decided.
I am also doing 2D images and 3D modeling for artistic purposes, since 2004. I was also obsessed by the powers of 2. I made images in The Sims section of my website at 1024×768 and rendered my artworks of 3D models (since 2004) at 2048×1536 (this is also half of the maximum resolution supported by AutoCAD: 4096×4096), with thumbnails at 256×192. For wide panoramas I was using 2048×1024 (I can call 16:8), being unaware of 16:9 standard.
Only in 2014 I realized that screen resolutions are more often formed by multiply of 160 or 240 (example 640, 800, 1280, 1440, 1600, 1680, 1920) and that 1024×768 and 1366×768 are the ONLY screen resolutions that do not follow this rule, and strangely they are most popular.
I decided that for future works, to use 1920×1080 as much is possible and 1440×1080 if 4:3 format is required, with thumbnails at 320×180 and 240×180. These numbers have advantage that they are divisible by 2, 3, 4, 5, 6, 8, etc, allowing better scaling of image thumbnails, unlike 1024 which is divisible only by 2, 4, 8, 16, etc.
(Dis)advantages of widescreen monitors
While arguing with my friends, I came to these myths:
Widescreen are close to golden ratio (1.618), match human vision, and can display 2 pages in Word.
ARE YOU KIDDING ME? When running Microsoft Word 2010 on Windows 7, subtracting taskbar, menus, toolbars, etc, the 1366×768 screen provide an actual working area of 1335×529 pixels (2.52 ratio, very uncomfortable), while a 4:3 1280×960 screen provide 1249×721 actual working area (1.73 ratio) which fits two A4 pages better but still not enough (1.50 ratio is needed). Actually, in most software having more vertical space give you more pleasure than having golden ratio.
Widescreens give you ability to have 2 windows side by side
ANY monitor can display 2 windows side by side, top by bottom, etc, but in most offices we work in a single software at time. “Wide” but less than ~1000 pixels vertical give me claustrophobic feeling. For hardcore multitasking you should get a widescreen of at least 1920 pixels horizontal.
Widescreens match HD movie formats
How often do we watch movies on computer? At office probably never, at home I can plug in my 40″ plasma TV which is widescreen anyway. Letterboxing is not a problem for watching just few movies on computer.
Widescreens give you better field of vision in games.
This is true. But not every computer is used for gaming.
Is 16:9 a downgrade from 16:10?
Some people say that 16:9 means downgrade from 16:10 and 4:3. But taking price in consideration, the 21.5″ 1920×1080 monitors starts around $100 similar with price of 17″ 1280×1024 and 19″ 1440×900 in late 2000s, for most people buying a 1920×1080 is a cheap upgrade.
24″ 1920×1200 was very expensive and never got more than 2-3% marketshare. If you paid $1000+ for a 24″ 1920×1200 in late 2000s then you can easily afford a 27″ 2560×1440 today.
You should compare like this:
17″ 1280×1024 (910 cm², 1310720 pixels) vs 19″ 1440×900 (1047 cm² 1296000 pixels)
20″ 1600×1200 (1239 cm², 1920000 pixels) vs 21.5″ 1920×1080 (1274 cm², 2073600 pixels)
These monitors are similar in area and pixels and similar in price too at some time in history, which one do you prefer and why?

This website is just gret. I’ve researched these info a long time and I realised that is good written, fast to comprehend.
I congratulate you because of this research that I am going to tell
to prospects around. I ask you to recommend the gpa-calculator.co page where each
pupil or college student can calculate ratings gpa marks.
Thank you!
i’m sorry to hear that this webpage didn’t get attention from your visitors and that’s the feedback you are looking for in order to maintain this amazing job. I tried myself to collect the information from the sources you used and got nowhere close to what you did here. This page is amazing and I write about it in my PhD. Kudos!
This is the 1st comment from a real human visitor after having this article for 5 years! Unbelievable!
(above comments were left by spam bots)
Actually I would like to update my screen resolution statistics again but not more than once per year due to insufficient feedback. But with StatCounter removing ability to download full list of resolutions in CSV and NetMarketshare removing all resolution statistics, I can only update W3Counter sheet.
it’s a pity that statcounter and netmarketshare are removing the resolution statistics. i am happy you will continue to update the statistics with what is left available but even if this page will stay without any updates it is still such a great work and contribution to the remembrance of what the world was/is alike.
Thank you for taking the time to put this information on the Internet. Itsba real help to me when researching what the most common resolution and aspect ratio were at a particular point in history. Major kudos to you 👏
I couldn’t agree more with @marcell mars. Have been looking at every stat I can get but they were of little to no use. This is so helpful! Deserves much more attention.
As a web designer (and probably doing quite a lot of coding), I can understand your need for 4:3/16:10 monitors.
But… I’m a photographer, and I chose a 21:9 monitor for the ability to fit more tools on the sides while working with image processing software; this way I’m able to have two lateral toolbars and still see an image (which usually starts from the common 1.5 ratio).
Coincidentally, I use the computer (a desktop, almost weird in 2019) for a bit of gaming and quite a few evenings of movies 🙂
On one thing I can agree: browsing the web is still done best on a 4:3 monitor (and I had a 19″/5:4 monitor which, at that time, seemed like a dream).
Congratulations on the very well researched and presented information, it was very helpful in understanding market trend and the history/reasons. Thank you!
Good job. Thank you. Much work! I am old 4:3 user, but last several years 16:10 (1920 x 1200) is my favorite; room on the side for panels (cad, photoshop, etc use side panels) plus enough vertical, imo.
What an interesting article, I was hoping someone had done a write up like this when I went searching. I was pleasantly surprised.