
Free version: make only
Paid version: make and model – Car Sales Data SAMPLE.xls
Description
I compiled this table in Excel sourcing data from CarSalesBase.com, a website I discovered in late 2016, thinking whenever worth my time making a database of car sales figures, I mentioned it in “possible upcoming projects”, someone was interested in this project in March 2017 so I started working at a script that extracted all yearly sales figures in few hours.
I provide 3 tables with sales by country, by make, by make and model 1948-2018 (complete) and another 3 similar tables 1948-2021 (missing 30% of models, make and country tables are complete).
Why? Because after updating successfully for 3 years (2017, 2018, 2019), problems started in 2020:
When CarSalesBase.com published 2019 data (end January 2020 for US and China, early February for Europe), the scraping script was running extremely slow (3 hours to scrap 269 pages and 20% pages failed = would have been faster to copy-paste manually). In mid-February website went completely down for about a month, then returned online with a new graphic design, but any car make I selected, I got redirected to a TEST page https://carsalesbase.com/test/ which have all makes mixed up in a single page, thus is impossible for a automated script to pick right data into right cell. Once they did fixed most errors, I updated in May 2020 to add 2019 data.
Due to above frustration and too few people buying this database (nobody demanded updates during 2021) I abandoned project. I revived project in March 2022 to update with 2021 sales figures, but the website is still a MESS: go on carsalesbase.com and test yourself, select random models from drop-down list and you will see that 30% cars give 404 NOT FOUND errors.
carsalesbase.com has closed in 2023, and redirects to another website https://www.goodcarbadcar.net/sales-by-model/, here sales figures for Europe, United States, Canada, China are shown on same model page, and inconsistency between headers pose a problem for me in extracting right data for each region.
Notes
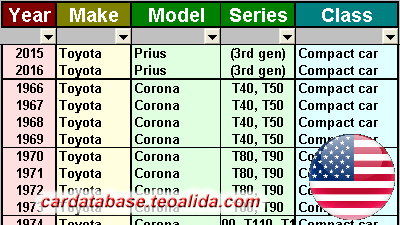
The whole table is 1948-2021 but actual figures are available only for recent years, usually American market figures starts at 1970, European market at 1990 or 1997 and Chinese market at 2003. Sales figures by make may not match total of sales figures by model, because models produced in small numbers are excluded.
Figures in this table may be different that sales data shown on manufacturer websites. For example Toyota officially include Russia in their European sales.
In this table, European car sales are total from the following countries: Austria, Belgium, Cyprus, Czech Republic, Denmark, Estonia, Finland, France, Germany, Great Britain, Greece, Hungary, Iceland, Ireland, Italy, Latvia, Lithuania, Luxembourg, Netherlands, Norway, Poland, Portugal, Romania, Slovakia, Slovenia, Spain, Sweden, Switzerland.
CarSalesBase.com also provide number of cars sold by month, but extracting this data is very difficult, because in each model page, rows represent month and columns represent years, if models are launched in different years, 2nd column in a model represent 2020 sales and in another model 2021 sales instead. And number of people interested in monthly sales figures is too small to justify my effort to update monthly. So I included only yearly sales.

Hello, How to get the engine data base for Asia manufacturer ( Japan, Malaysia, Korea )
For which market do you need data? Japanese models are included in my databases according market of sale, read more https://www.teoalida.com/cardatabase/america-europe-rest-of-world/
Thank for your reply, especially Malaysia market including local manufacturer of Proton and Perodua
on 19 September shortly after you left this comment, I emailed you a sample of Malaysia database and you never replied me. The database became a public product a month later: https://www.teoalida.com/cardatabase/malaysia/
Hello, Do you have a Brazil database? Sales by make. thank you
Wow, that’s what I was looking for, what a data! existing here at this blog, thanks admin of this web site.|
Deleted link: instapaper.com/read/1249598881 (site no longer active)
Has there also been constructed a dataset where the Data has been broken down by european country( i wouldbe interested in Norway, Finland, Denmark, Sweden) by model over the time horizon from the 90s to now?
Im sorry I am referring to sales data
Hi Team
im building a market place in australia and looking for every car sold in Australia for my search bar, can you help with this ? trying to achieve a search bar like carsales.om.au