
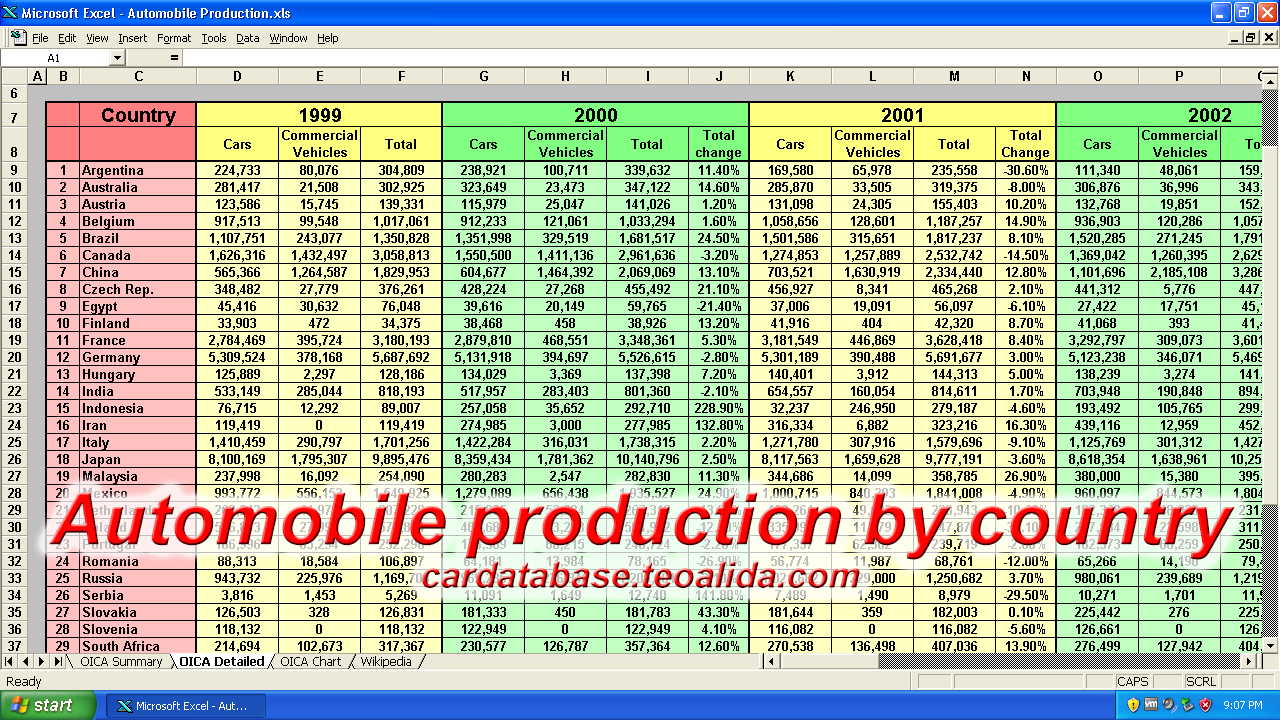
 Source of data: www.oica.net/production-statistics which every year in March publish a report with production figures for previous calendar year. I compiled data of all years in one Excel database.
Buy full database:
Countries included
Breakdown is available by 40 countries: Argentina, Australia, Austria, Belgium, Brazil, Canada, China, Czech Republic, Egypt, Finland, France, Germany, Hungary, India, Indonesia, Iran, Italy, Japan, Malaysia, Mexico, Morocco, Netherlands, Poland, Portugal, Romania, Russia, Serbia, Slovakia, Slovenia, South Africa, South Korea, Spain, Sweden, Taiwan, Thailand, Turkey, Ukraine, United Kingdom, United States, Uzbekistan.
At least other 10 countries have car factories but they are included in “others”.
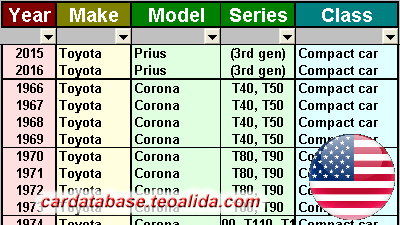
Database contain only total number of passenger cars and commercial vehicles produced yearly by country. Database does NOT contain breakdown by make, model, fuel type, etc. Such details can be obtained from automobile associations of each country.
World car production review
The global automobile production has increased from 56 millions in 1999 to 73 millions in 2007, felt down to 61 millions in 2009 during world recession then continued to increase, reaching over 97 millions in 2017 (cars and commercial vehicles).
The biggest automobile manufacturing country was United States during 1990s to 2005, while China was on 9th place in 1999. United States was briefly overtaken by Japan from 2006 to 2010, period in which China also experienced a massive car production boom, growing from 9 millions in 2008 to 14 millions in 2009 becoming the world leader, and 18 millions in 2010, China production continued to increase at slower rate, reaching 29 millions in 2017, followed by United States with 10 millions and Japan with 9 millions. With other words, as 2017 approximately 30% of world automobile production is located in China.
Another spectacular growth is the automobile production in India, which grown from 800 thousands in 1999 (15th place) to nearly 4.8 millions in 2017 (5th place).
Automobile production divided by country population put South Korea on 1st place from 2009 to present, previous title holder was Japan.
See also:
www.oica.net/category/vehicles-in-use/
cta.ornl.gov/data/chapter8.shtml detailed data about United States such as number of households, vehicles in use, vehicles per household, miles driven, etc.

Thank you so much ! This DB is really useful.
Hi Sir, i would like to have this list ”Automobile production by country” for free PLEASE
paid and didn’t get the file
please check my account this is UNACCEPTABLE
If you have any problem that require my attention, please contact me using LiveChat in lower-right corner of screen.
I don’t look at comments on regular basis. I saw your comment today and checked logs: you paid at 19:05, left comment at 19:06 and downloaded file at 19:16.
I assume that email with download link went to SPAM folder or to Inbox with delay. Is also UNNACCEPTABLE to complain in just one minute after payment.