Hong Kong Housing Authority provide annual reports with figures for current year and for comparison, figures from 5 and 10 years ago. If I dig around internet and able to find annual reports for each of last 5 years I may be able to create charts with year to year evolution for last 15 years.
BUT, my website gets very little traffic from Hong Kong, this particular page (Housing statistics) got only ~30 visitors per month + lack of feedback (to inform me what statistics would you like to see), I stopped researching Hong Kong in 2012 to focus on other countries, and will no longer update this page. Look on government website (housingauthority.gov.hk) for latest figures.
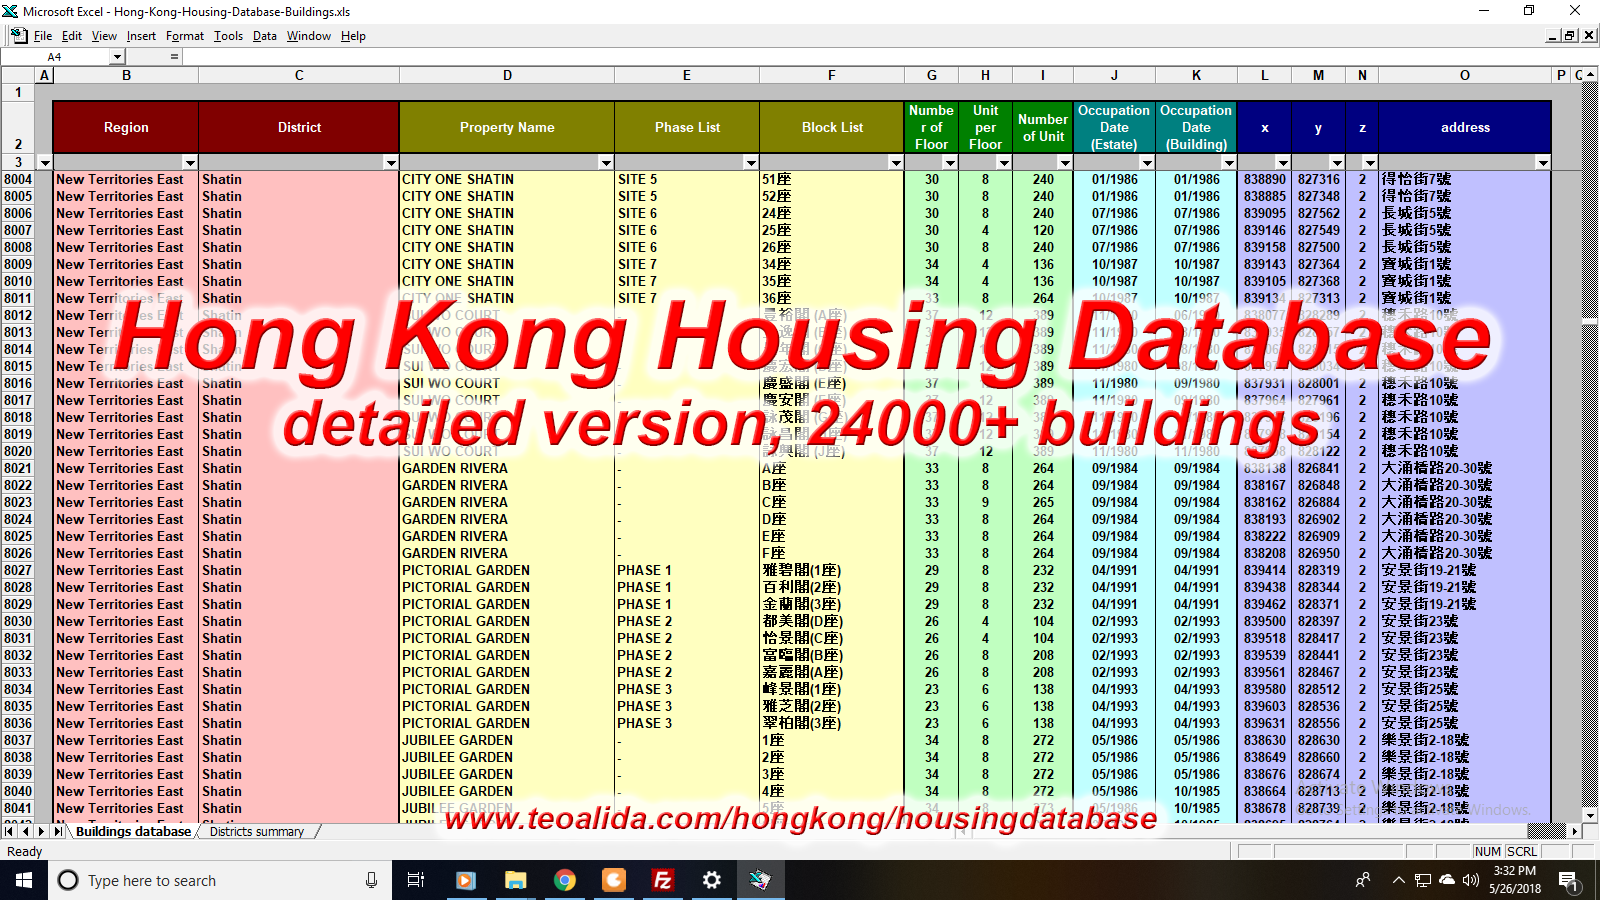
See also: Detailed housing database in Excel format and Gross vs Saleable floor area.
Per total, 53% of housing are owner-occupied. Is hard for me to make estimation about average apartment size in Hong Kong or about the ratio sqm per person, due to lack of detailed statistics about housing system, high income inequality, many people living in extremely small 1-room apartments, illegally-divided apartments, as well as boathouses, caged homes, rooftop huts and other forms of inhumane homes.
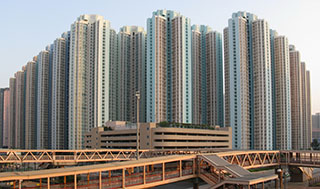
Public housing
Public Rental Housing (usually having “Estate” at end of name) have flats usually 20-60 sqm, but a small number of flats are even 8 sqm (internal floor area).
Home Ownership Scheme (usually having “Court” at end of name) have flats usually 30-60 sqm but a small number of flats are 19 sqm (saleable floor area).
Private Sector Participation Scheme (usually having “Garden” or “Terrace” at end of name) have flats usually 35-70 sqm (saleable floor area).
Tenants Purchase Scheme are usually 20-65 sqm, but a small number of flats are even 8 sqm (which floor area?).
The biggest public flats are located in Melody Garden and Neptune Terrace, being 80 sqm (saleable floor area).
PRH and non-purchased TPS flats houses 31% of population, while HOS, PSPS and TPS houses 17% of population.
As 2011, Housing Authority have exactly 400 estates under management, of which 204 PRH/TPS and 196 HOS/PSPS.
According Housing Authority Annual Report 2010, as 31 March 2010 were 703,608 PRH flats and 437,184 of HOS/PSPS/TPS flats.
PRH flats comprised 679,822 households, average of 2.95 people, 12.6 sqm per person. This means average flat size of 36.5 sqm.
Housing Authority do not provide information about how many people live in HOS/PSPS/TPS flats but I estimate their average flat size around 45-50 sqm.
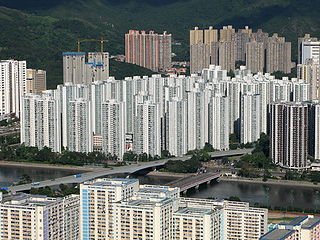
Private housing
Private housing in Hong Kong include tenement buildings, stand-alone buildings, private housing estates, villas and village houses. Flat sizes are sometimes even smaller than Home Ownership Courts, since most flats are aimed to same group of low-income people like public housing, and private developers are desperate to fit as many units is possible under permissible gross floor area. The difference are the facilities: swimming pools, security guards, and large private estates have shopping centres at first floors (some public housing estates also include commercial space).
There are NO official statistics about average size of private housing. No wonder that may be under average HOS flat size.
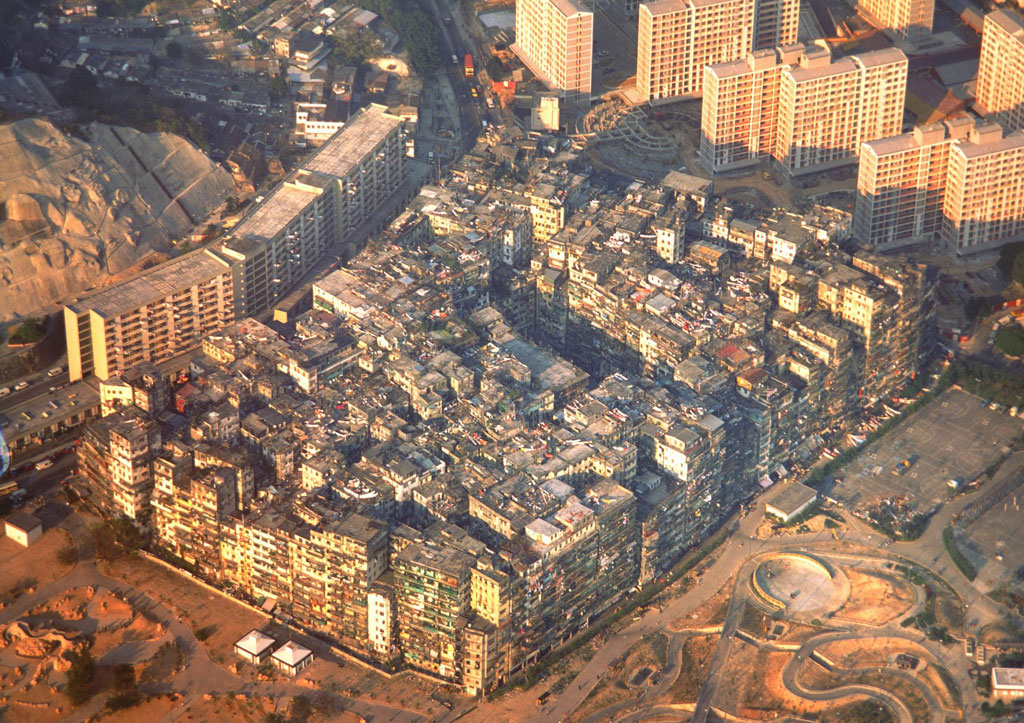
Old apartments (1960s) are bigger than today ones, many of them were subdivided illegally into 10-15 sqm units or even smaller. Since this is illegal, nobody track the size of them.
According khournal.org (2010), over 90% of Hong Kong families today live in homes smaller than 700 square feet (65 sqm).
Some statistics about private housing, especially about prices, counts only apartments less than 70 sqm. Probably that is the limit over which the price per square foot increase like crazy.
Some private developments contain apartments big as 200-500 sqm, they being some of the most expensive apartments of the world. Example: Most expensive in June 2008, Most expensive in Oct 2009.
Distribution of Population by Type of Housing
| Year (as 31 March) | 2000 | 2005 | 2010 |
| Mid-year Population | 6,665,000 | 6,813,000 | 7,061,000 |
| Public Permanent Housing | 50.7 | 48.5 | 47.5 |
| – Rental Flats | 35.1 | 30.1 | 29.7 |
| – Subsidized Sale Flats | 15.6 | 18.4 | 17.8 |
| Private Permanent Housing | 47.9 | 50.6 | 51.6 |
| Public Temporary Housing | 0.1 | – | – |
| Private Temporary Housing | 1.3 | 0.9 | 0.9 |
Land Domestic Households
| Year (as 31 March) | 2000 | 2005 | 2010 |
| Public Permanent Housing | 47.8 | 46.4 | 46.5 |
| – Rental Flats | 33.3 | 29.8 | 30.1 |
| – Subsidized Sale Flats | 14.5 | 16.6 | 16.4 |
| Private Permanent Housing | 50.5 | 52.4 | 52.4 |
| Public Temporary Housing | 0.1 | – | – |
| Private Temporary Housing | 1.6 | 1.3 | 1.1 |
Average Domestic Household Size
| Year (as 31 March) | 2000 | 2005 | 2010 |
| Public Permanent Housing | 3.5 | 3.2 | 3.0 |
| – Average household size in Public Rental Housing | 3.5 | 3.1 | 2.9 |
| – Average Living Space per Person in PRH estates | 10.4 sqm | 11.7 sqm | 12.6 sqm |
| – Average PRH flat size (calculated) | 36.4 sqm | 36.3 sqm | 36.5 sqm |
| – Average household size in Subsidized Sale Flats | 3.5 | 3.4 | 3.2 |
| Average household size in Private Permanent Housing | 3.1 | 2.9 | 2.9 |
| Average household size in Public Temporary Housing | 2.3 | – | – |
| Average household size in Private Temporary Housing | 2.7 | 2.3 | 2.4 |
Stock of Permanent Residential Flats
| Year (as 31 March) | 2000 | 2005 | 2010 |
| Overall | 2115 | 2408 | 2537 |
| Public Housing | 1016 | 1096 | 1135 |
| – HA PRH Flats | 651 | 661 | 674 |
| – Housing Authority Interim Housing Flats | 4 | 8 | 5 |
| – Housing Society Rental Flats | 33 | 33 | 34 |
| – Housing Authority Subsidized Sale Flats | 310 | 368 | 376 |
| – Housing Society Subsidized Sale Flats | 19 | 18 | 17 |
| Private Housing | 1099 | 1312 | 1401 |
Source of data from above tables: http://www.housingauthority.gov.hk/hdw/content/document/en/aboutus/resources/statistics/HIF2010.pdf